Storytelling Trends & Statistics 2024 Worldwide
A Deep Data Dive into the World of Narratives in Filmmaking and Marketing
According to psychologist Jerome Bruner's research, facts are 20 times more likely to be remembered if they're part of a story. It's unsurprising then that video is the most popular and effective marketing format and that 50% of marketers use video in their content marketing strategies.
Storytelling transforms raw narratives into something more humane and relatable and condenses concepts into believable, tangible ideas everyone can understand. The visual narrative also endears viewers to the characters portrayed and makes the messages expressed more memorable.
To gain better insights into storytelling's impact on film and video marketing, we've surveyed over 4.1 million people on social media platforms like TikTok and Reddit for a full year, ending September 9th, 2024. Here's what we found.
Nearly Half of Those Surveyed Use Storytelling in Their Work
42.1% of over 4.4 million respondents indicated they use storytelling in their work, citing visual storytelling as the form they are most reliant on.
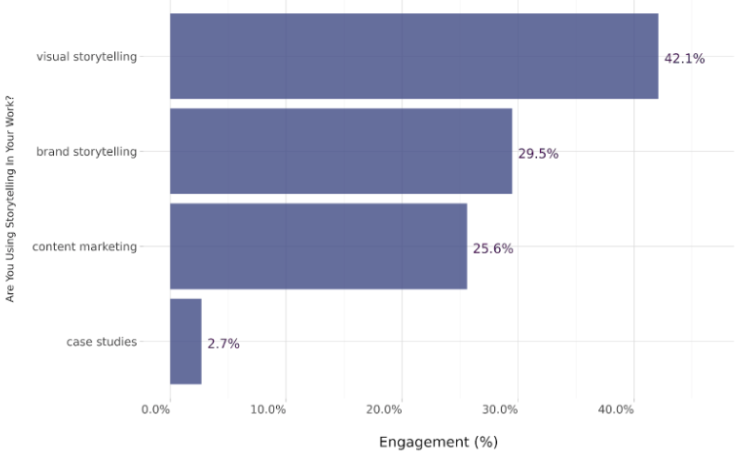
From LinkedIn to the Journal of Science Communication, everyone agrees that visual storytelling is one of the most important aspects of current-day marketing, highlighting its unique ability to engage both the senses and emotional impulses of consumers.
In addition to visual storytelling, survey respondents also state that brand storytelling (29.5%) and content marketing (25.6%) are key components of storytelling in marketing for more effective engagement and reach. Case studies, however, are not considered hugely important, garnering just 2.7% of survey engagement.
22% Respondents Learned Storytelling Techniques from Films
Films and books: two of modern history's most enthralling forms of visual storytelling to date—and the data reflects this fact.
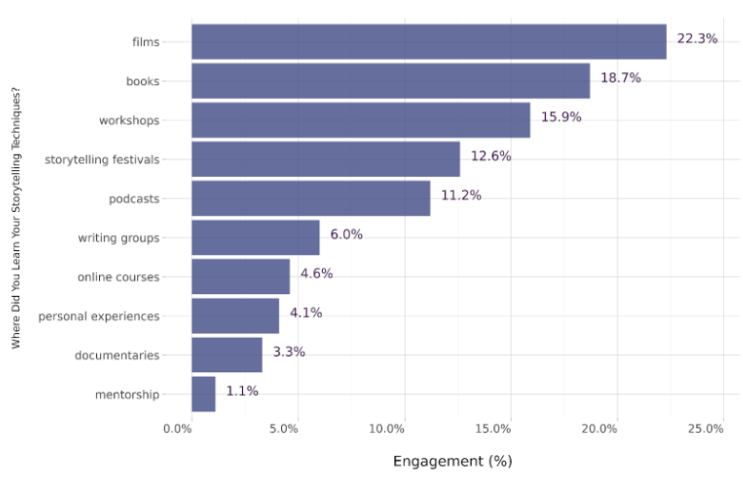
22.3% of respondents cited "film" as their source for learning storytelling techniques, and 18.7% cited "books." Both films and books teach the greater consumer market a considerable amount about storytelling. However, other forms, such as workshops (15.9%), storytelling festivals (12.6%), and podcasts (11.2%), remain core aspects of how people are learning about different storytelling techniques in the digital age.
Podcasts Are the Most Used Media Type for Storytelling in 2024
Many different types of media are used to create stories for the consumer market today, but podcasts are among the most prevalent.
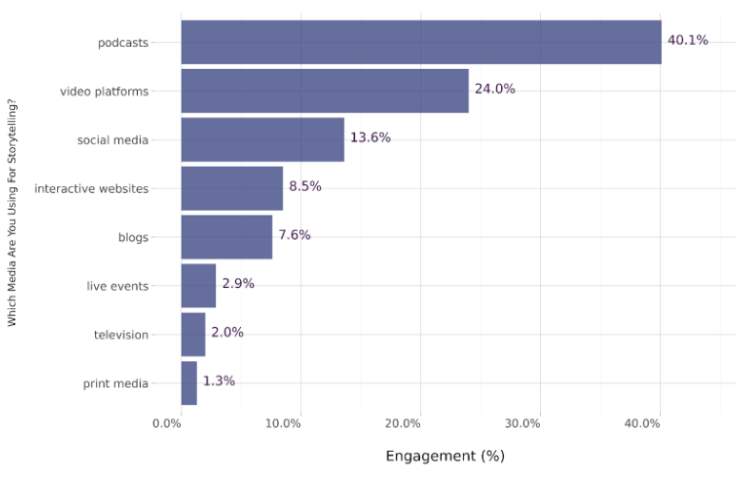
Accounting for a whopping 40.1% of the media type used by respondents, podcasts have skyrocketed in popularity in 2024. 59% of US consumers aged 12-34 have listened to at least one podcast in the past month, and 66% of consumers say they prefer podcasts to TV.
Video platforms get just over half the engagement of podcasts at 24%, followed by social media at 13.6%. Interactive websites and blogs are closely tied at 8.5% and 7.6%, respectively, while live events (2.9%), TV (2%), and print media (1.3%) limp in last.
The Setting Is the Most Important Element of Storytelling for Marketing
There are many important elements to a successful story in marketing: the theme, point of view, dialogue, pacing, character development, and plot structure. However, according to the 4.2 million+ people we surveyed, the setting is the most vital to success.
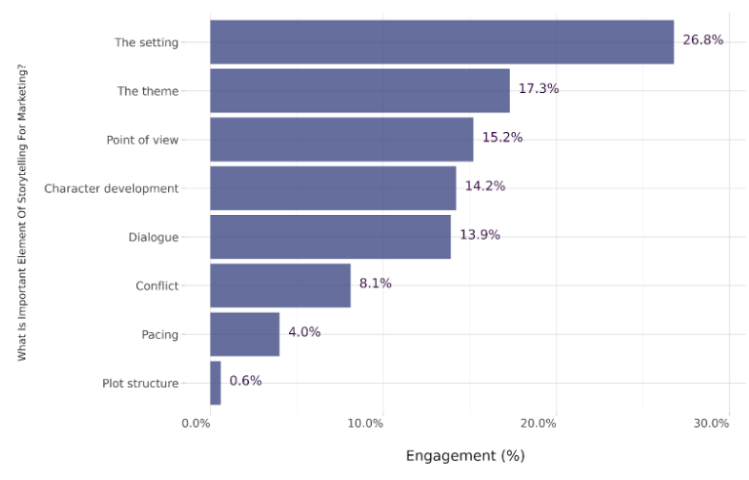
Representing 26.8% of engagement, the setting of a story is more crucial to effective storytelling than anything else. In between setting and plot structure was the theme at 17.3%, point of view at 15.2%, character development at 14.2%, and dialogue at 13.9%. Thereafter, there was conflict (8.1%) and pacing (4%).
Trust Is the Emotion That Storytelling Elicits Most Toward a Brand
According to our results, a vast portion of people feel that trust is the most evident emotion their storytelling techniques elicit toward their brand.
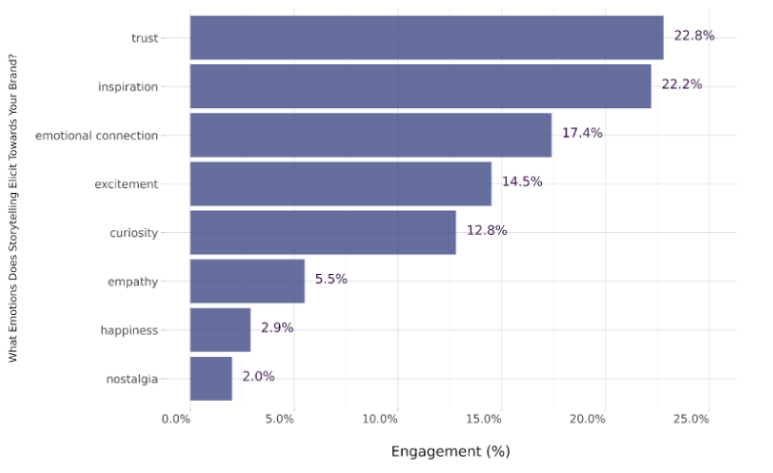
81% of consumers hold trust as a crucially important factor in whether or not they choose to buy products or services from an organisation, and 95% are likely to stick with a brand they feel they can trust.
The next most prevalent emotions are inspiration (22.2%), emotional connection (17.4%), excitement (14.5%), and curiosity (12.8%). Other emotions, such as empathy (5.5%), happiness (2.9%), and nostalgia (2.0%), accounted for the least significant results.
Increased Engagement Is the Major Benefit of Storytelling in Marketing
Storytelling has the potential to improve marketing strategies in a variety of ways.
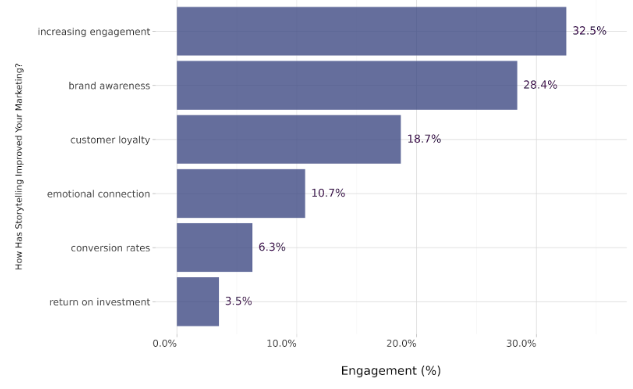
Data-driven storytelling can increase sales by 30% and boost engagement rates by 300%. Other ways that respondents claim storytelling has improved their marketing include brand awareness (28.4%), customer loyalty (18.7%), emotional connection (10.7%), and higher conversion rates (6.3%), with ROI taking last place at 3.5%.
Social Media Trends and Interviews Are the Most Significant Sources of Data-Driven Storytelling
Our survey found that social media trends played the biggest role in data sourcing, with 30.8% claiming that trends on these populous digital platforms are where they gather their ideas.
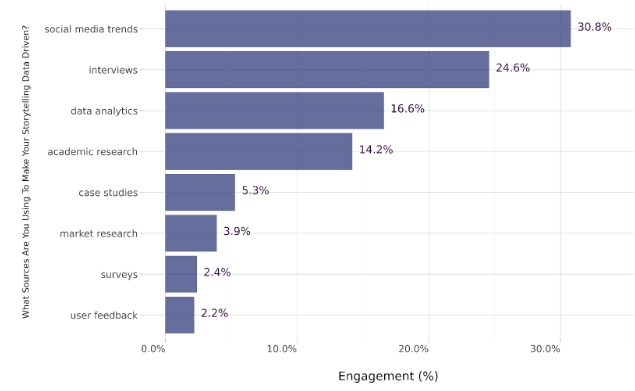
Interviews were the second-most popular answer at 24.6%. Data analytics (16.6%), academic research (14.2%), and others still represent active spaces for content creators to explore narrative trends and concepts.
Data Visualisation Tech and Tools Are the Most Popular Way to Display Visual Storytelling
Data visualisation tools top the charts. Our survey found that 53.5% of respondents use data visualisation technology as their number-one way to display visual storytelling.
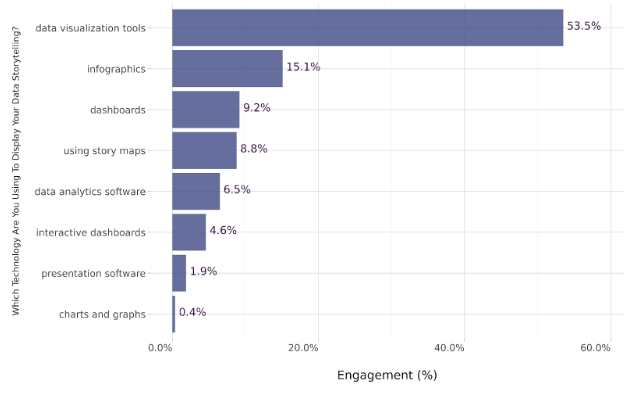
The next most popular mechanism was infographics (15.1%), followed by dashboards (9.2%) and visual story maps (8.8%). Data analytics software is only used by 6.5% and interactive dashboards at 4.6%.
Research Support Is the Most Common Way to Incorporate AI into Storytelling
AI has been rapidly integrated into content creation, automation, and strategy development. However, we found that research support is the most significant way people incorporate AI into their marketing storytelling.
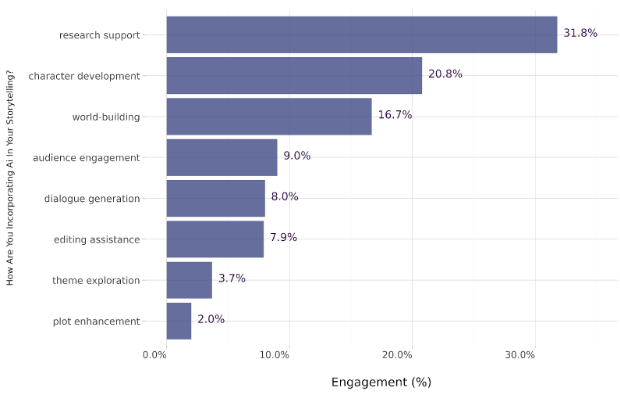
31.2% of respondents listed research support as the most relevant. 20.8% use AI for character development and 16.7% for world-building, while 9% use it for audience engagement and 7.9% for editing assistance.
The Age Group with the Highest Storytelling Engagement Is Age 65+
It's common to associate media consumption with younger generations, but our data indicates otherwise. The age group with the highest response rate was 65+.

Engagement for other age groups: 45-54 (19.1%), 55-64 (18.6%), 35-44 (14.5%), Under 25 (13.6%), 25-34 (14.5%).
More Women Than Men Are Receptive to Visual Storytelling
Our data shows that women engaging in the topic online make up 57% of the dataset, whereas only 43% were male.
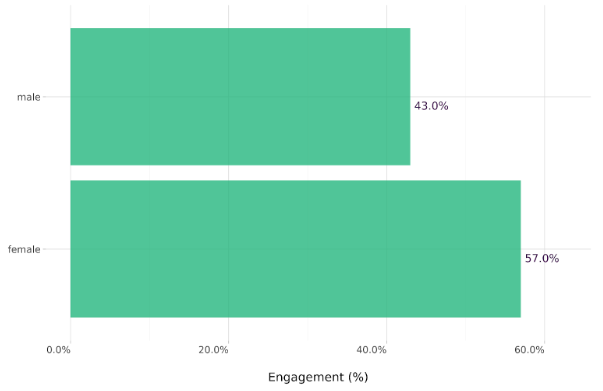
Video and film producers may stand to benefit more from creating visual content whose storylines align more closely with the feminine perspective, accommodating the evident interest in the art and techniques of storytelling.
35.9% of Respondents Earn Between $120k and $200k a Year
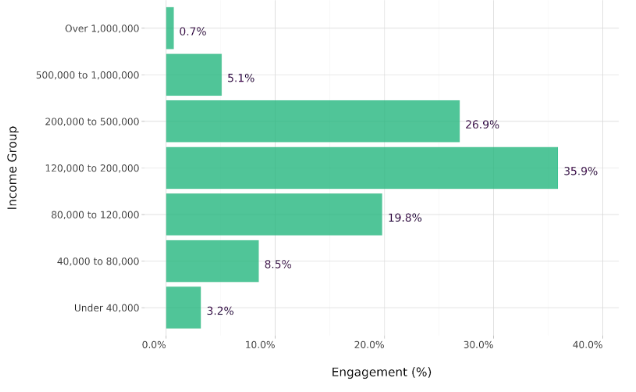
26.9% earn $200,000 to $500,000, and the rest either earn less than $80,000 (11.7%) or over $1 million (0.7%). This suggests that people belonging to middle and working-class income brackets represent the majority of those producing or consuming narrative-driven video content.
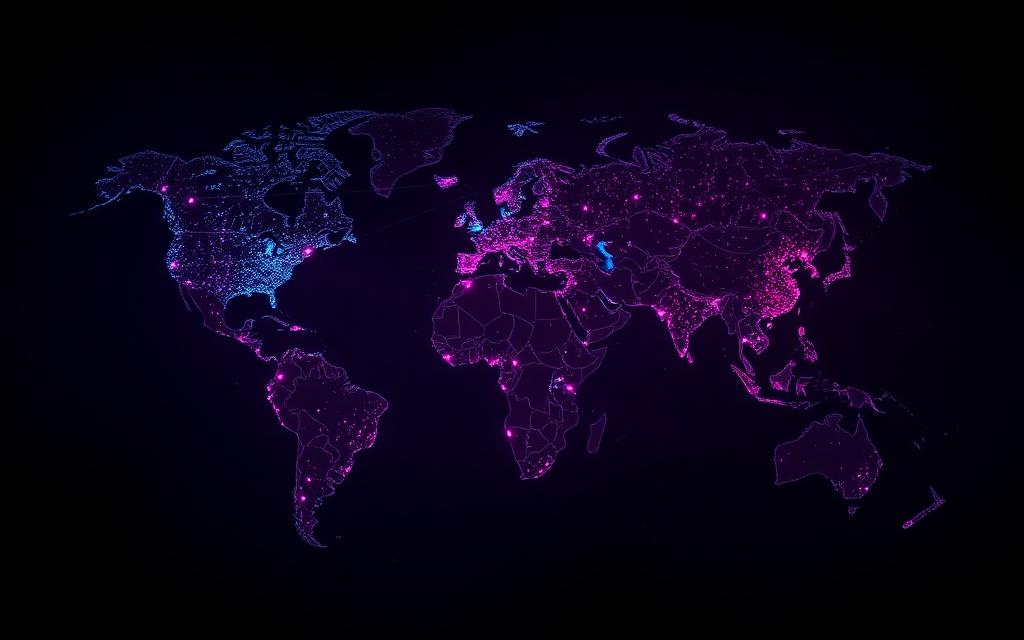
Americans Top the Visual Narrative Content Consumption Market
A vast majority (64%) of the respondents who participated in our survey are American.
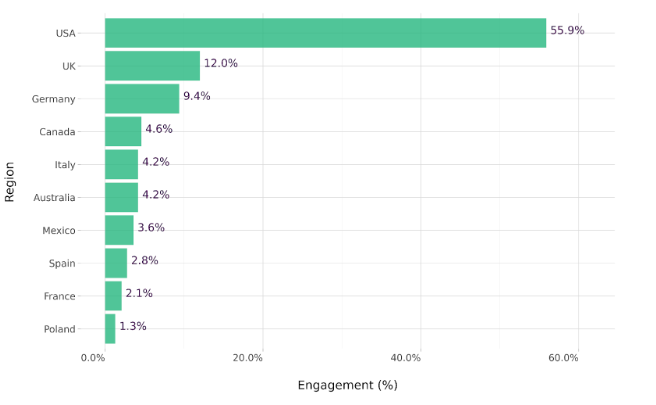
Americans are the foremost consumer market on the planet. The data also reveals that UK and German engagement was high, while Canada, Italy, Australia, Mexico, Spain, France, and Poland all had minimal engagement, ranging from 4.6% to 1.3%.
About the Data
The data was sourced from an independent sample of 4,142,569 people worldwide from X, Quora, Reddit, TikTok, and Threads. Responses are collected within a 95% confidence interval and 4% margin of error.